Teaching the auto-optimization loop to write Pallas kernels
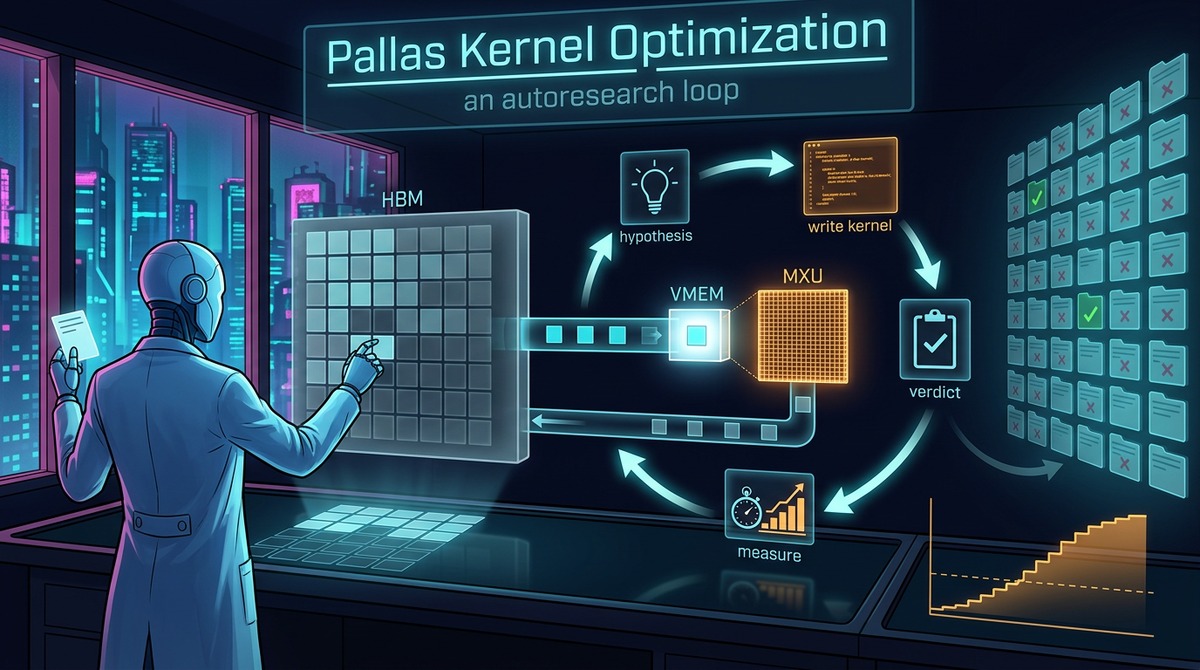
Every post in this series so far has been about the model lane of the TPU Model Performance Auto-optimization project: an autoresearch loop that proposes a hypothesis, patches model code, benchmarks on real hardware, reads the profile, and files a verdict — end to end, reliably, on any harness, grounded in wikified codebases.
This post is about pointing the same loop one level down the stack, at hand-written Pallas kernels.
That it works at all was not the surprising part — even the very first version of this project, before any specialized skills existed, could write and tune Pallas kernels in Claude Code. What I didn’t expect is that the kernel lane would turn out to be a much better laboratory for the process than the model lane ever was. Two things came out of it that I hadn’t planned for: a second loop that optimizes the process instead of the code — recursive self-improvement, narrow but real, and a good chunk of what the kernel lane runs on today was written by it rather than by me — and a process-auditor sub-agent that ended up being the single change that made unreliable models usable autonomously.
To try it out yourself, see the Starting Kernel optimization experiment section in the project’s README.
🧬 Why kernels are a different problem than models
On the surface it’s the same problem, just smaller. Something is slow, form a falsifiable hypothesis about why, change code, measure, keep or discard. But two practical differences change the engineering completely.
Iteration takes minutes instead of hours. A model experiment means building a container, submitting a workload to a GKE cluster, waiting for the step time to stabilize, then capturing a profile. A kernel experiment is a Python module and one TPU chip. That’s what makes the second loop below affordable: if you can run 400 kernel experiments, you can afford to spend some of them measuring your own process instead of your kernels.
There is something to lose to. In the model lane there’s no competing product. Beating hand-optimized MaxText is the bar, and “an agent did this unattended” is the whole result. For kernels there’s MaxKernel, a dedicated ADK-based kernel generation system the team has spent months tuning, with published numbers on a public benchmark suite. That’s a much less forgiving environment, and a much more useful one — a head-to-head tells you straight away whether a generic autoresearch loop is actually competitive with a purpose-built pipeline, or just producing good-looking research trails.
I’m not the only one in this area. autokernel does agentic CUDA kernel optimization explicitly, and AWS shipped a set of Neuron kernel-development skills. Neither pairs kernel authoring with a full hypothesis→verdict loop over a persistent wiki, which is the part I wanted to test.
🔁 The kernel loop, next to the model loop
The kernel lane isn’t a new system. It’s the model loop from the earlier posts, re-pointed one level down the stack, and the easiest way to explain it is to put the two side by side.
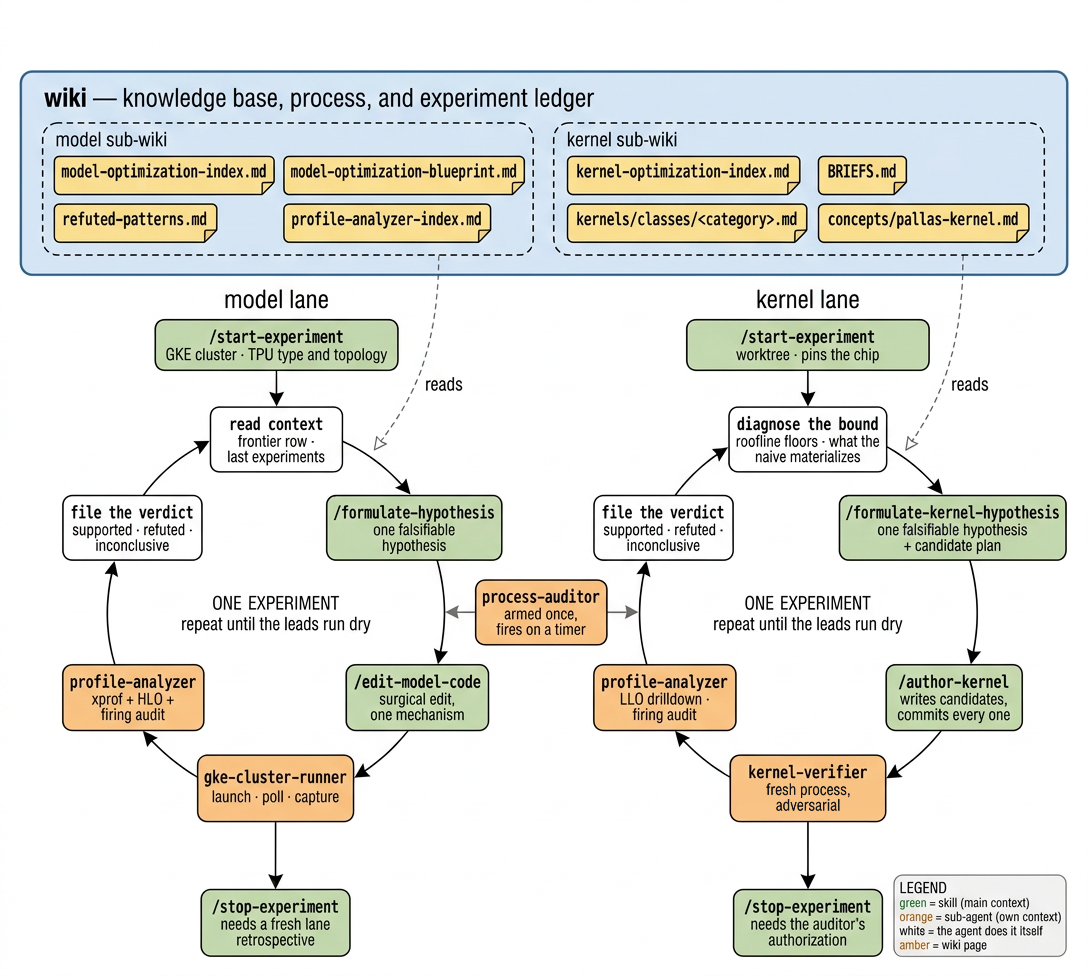 Green is a skill running in the main context, orange is a sub-agent with its own context window, white is something the agent does itself. Both lanes read their own slice of the same wiki, and both are watched by the same auditor.
Most of it is the same loop. Both lanes start with /start-experiment, orient themselves, produce one falsifiable hypothesis through a skill, change code through a skill, hand off to a sub-agent, analyze the profile, file a verdict, and go round again until they earn the right to stop. profile-analyzer is not merely an analogous component in the two lanes — it’s literally the same sub-agent, with one extra phase that does the inside-the-kernel drilldown. The process auditor in the middle is shared too; it just picks a different checklist depending on which lane it’s watching.
Two things differ, and both matter.
A new sub-agent, kernel-verifier. Authoring and grading are split: whoever wrote a candidate never produces the evidence its verdict cites. So a separate sub-agent re-runs the measurement in a fresh process — co-timing the candidate against the baseline to produce the speedup number the verdict actually quotes — re-checks parity against the oracle, and audits the compiled program to confirm the kernel fired. Kernel experiments are cheap to run and easy to fake: a kernel that never fired, a parity check that passed vacuously, a speedup that came from somewhere else. Catching that is the whole job, and it gets its own section further down.
Where it runs. Model optimization works on either a GKE cluster or a local VM, and the kernel loop now does too: the run target — a local chip or a persistent single-node GKE pod holding chips of whatever TPU generation the cluster offers — is chosen once per run, and every device command goes through the same execution shim either way, so the authoring and verification tooling can’t tell the difference. The pod path matters when the target generation differs from the local VM (kernel tuning can invert across generations) and keeps itself honest: artifacts must go straight to GCS so the pod stays stateless, and a hard TTL reaps it even if teardown is missed. As long as a kernel doesn’t need cross-chip communication — and most don’t — each experiment can be pinned to its own TPU chip, so several kernel families run in parallel on a single VM, one per chip; multi-host op-points are still the open TODO.
The first step is what keeps the loop directed rather than a sampler. Writing a kernel is the expensive move, so it has to be earned. Ask an LLM to “optimize this kernel” and it writes a Pallas kernel, because that’s the salient thing to do. Often the right answer is a compiler flag, an algebraic rewrite, or nothing at all — and proving that is a legitimate result here, not a failed experiment.
The last thing the diagram doesn’t show is that the two lanes compose, which turned out to matter more than I expected. A model experiment that finds a slow op can spawn a kernel family at that exact operating point, and a kernel win doesn’t get merged until it’s been validated end-to-end back in the model lane. That coupling is also what keeps the benchmark honest: a kernel experiment may only claim to be an optimization if its operating point came from a real model profile. Anything taken from a benchmark suite is labelled a capability evaluation and is barred from the production frontier.
🔎 xprof-cli and the LLO layer — seeing inside the kernel
Diagnosing the bound before authoring only works if the loop can actually see the bound, and that took two changes to the profiling layer since the last post.
The first is that what earlier posts in this series called the xprof MCP server is now xprof-cli, and that’s more than a rename. It started life as an MCP server because that’s the obvious way to give an agent a tool, but MCP turned out to be clunky to set up in practice. Every harness wants it registered its own way, the config has to be right before the agent can do anything, and there’s a server process that has to be running and pointed at the right log directory. That’s a lot of ceremony to read a profile, and in an unattended loop it’s one more moving part that can silently go stale.
So I replaced it with a plain CLI. Same 40-odd tools over XProf, invoked straight from a shell — xprof-cli get_overview --logdir=… --run=… — running in-process with nothing to start. There’s no setup at all: any agent that can run a shell command can use it, identically across Claude Code, Codex and Antigravity, which matters for the same portability reasons as the previous post. A profile captured seconds ago is readable on the very next call. The MCP transport still works and is kept around, but it’s legacy now.
The second change is the one that made the kernel lane possible at all. Profiles and HLO tell you which op is slow. For kernel work you need to know why, inside a single kernel, and that lives one level down in the LLO (low-level operations) layer — the machine instructions XLA’s TPU backend actually schedules onto the functional units. Google announced deep kernel profiling support for exactly this in June: Unlocking TPU performance: deep kernel profiling with XProf. xprof-cli leverages it, and exposes it as tools an agent can call:
get_llo_fit_summary— a one-screen kernel digest: VMEM allocated against the scoped limit, MXU operand width and matmul count, per-unit occupancy across MXU / VPU / load / store / scalar, register spills and fills per bundle, and a timeline classifying every bundle as overlap, MXU-only, memory-stall or bubble.get_llo_utilizationandget_kernel_stage_breakdown— per-unit utilization and Mosaic pipeline-stage timing over the real kernel spans, with DMA wait ratios.get_llo_bundlesandget_llo_schedule_analysis— the individual VLIW bundles and their HLO attribution, so a run of stalls can be traced back to the instruction that caused it.
Register spilling, half-empty MXU pushes and serial VPU dependency chains are invisible to a trace viewer, and in a Pallas kernel they’re routinely the whole story. Without this layer the loop can see that a kernel is slow but not which resource is binding, which is exactly the situation where an agent starts sweeping block sizes at random.
One caveat worth stating, since it shapes what the numbers in this post rest on: runtime performance-counter sampling needs v7/Ironwood. This campaign ran on v6e, so the LLO reading here is the static analysis — occupancy, spills, VMEM pressure, pipeline classification — which is enough to classify the bound and pick a lever, but not the measured per-cycle telemetry the announcement describes on newer chips.
💡 Discovery #1 — recursive self-improvement, in a narrow domain
Because kernel experiments are cheap, you can afford to run two loops.
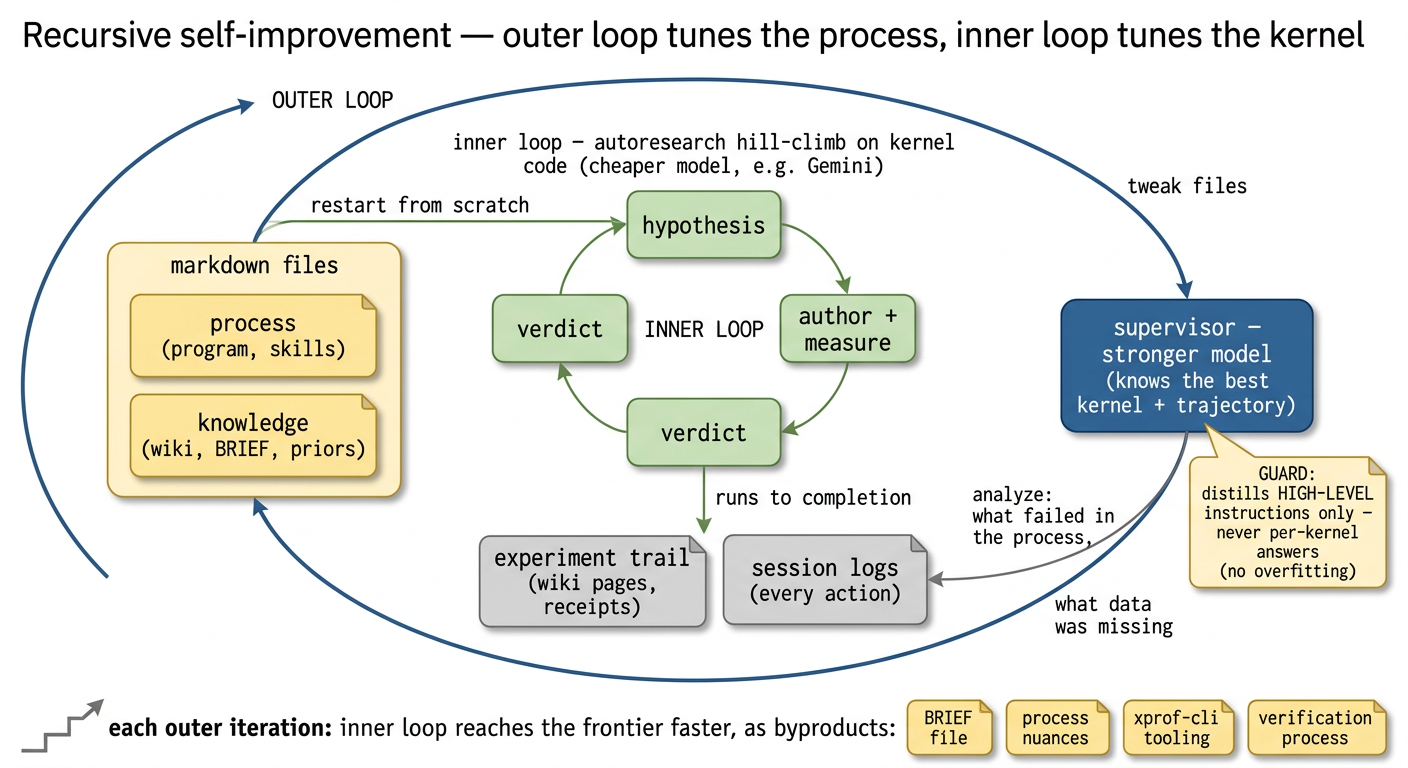 The inner loop hill-climbs on kernel code. The outer loop reads what it left behind — experiment trail and session logs — and edits the markdown that drives the inner loop: the process files and the knowledge files, never the kernels.
The inner loop is ordinary autoresearch doing the full hill climb on kernel code. When it’s done, the outer loop reads its session log and asks a different question: what about this process made the hill climb slower than it needed to be, and what knowledge was missing from the wiki? Then it edits the process and knowledge files, which are all just markdown, and restarts the inner loop.
This is recursive self-improvement, in the narrow sense — an idea I brought up back in the first post of this series. The model isn’t improving itself; the weights never change. Everything around the model is: the instructions it follows and the knowledge it reads before it starts working. In a domain this narrow that isn’t speculative, it has already happened. A large part of both the process and the knowledge base the kernel lane runs on today was written by the loop, not by me. Specifically:
BRIEFS.md— the distilled file every kernel author loads before writing anything. The outer loop noticed which failures kept repeating across sessions and wrote the rules that prevent them.- The sequencing rules: what gets checked in which order, when to kill a candidate early, when a sweep is allowed to start.
- The profiling gaps. The loop kept reaching for signals xprof-cli didn’t expose yet, and that list became the LLO tooling work above.
- The verification process, which grew big enough to get its own section below.
It works because a stronger model can play supervisor. It has seen what the best kernel and the best trajectory to that kernel look like from its own runs, and its job is to restructure the process and the priors so that a weaker model gets to the same place. Out of the box Gemini writes poor Pallas kernels. After a few outer-loop passes the process is shaped so it follows the known-good hill-climb strategy, and its numbers move a lot.
The obvious risk is overfitting — an outer loop that “improves the process” by quietly leaking answers for the kernels under test. The guard is that it may only distill high-level, kernel-agnostic instructions, keyed to op classes and mechanisms rather than to specific problems, and per-kernel material is explicitly kept out of cold author briefs. Distilling how to search transfers to the next kernel; distilling this kernel’s answer doesn’t, and it poisons the benchmark.
It’s fair to say the agent shaped a large fraction of what this looks like now, and my job was mostly keeping it from going off course.
How that knowledge ended up organized
One structural result is worth calling out on its own. The kernel knowledge settled into three tiers, and which tier a page belongs to decides whether it can be rebuilt or only appended to.
kernel-optimization-index.md is regeneratable. It’s a router rather than knowledge: the core thesis, the categories, and a load mandate that says exactly which pages get pasted into an author brief for a given kernel category. Throw it away and rebuild it from the wiki with a canned prompt.
BRIEFS.md is not, and holds the rules that apply to every kernel: measurement, parity, evidence, platform gotchas. Every one of them was paid for by a specific failed run and can’t be learned any other way — a 48 ms kernel that got read as 1.13 ms because the timing wasn’t jitted, a parity check that passed vacuously because the benchmark’s shipped inputs were all zeros, a “VMEM wall” that was really a 32 MB default, a firing audit written from the model’s own design intuition with no capture behind it.
wiki/kernels/classes/ is the same kind of earned knowledge, but per class. Seven pages, one per kernel category — attention, GEMM+epilogue, streaming reduction, grouped/ragged/indirection, state-carry scan, dense-near-roofline, cross-chip collective. The loop routes to one of them from the diagnosis, not from the op’s name, and each page carries when to route there, what the signature looks like, a yardstick for when are you done, and a list of levers that have actually worked on that class, with the conditions under which they don’t. attention.md is the deepest with eleven, state-carry-scan has eight, and the classes nobody has pushed on hard yet are nearly empty — the depth just tracks how much work that class has absorbed. Some levers carry their provenance in the text: the compact causal grid is annotated worker-discovered, receipt-verified, adopted 2026-07-24.
The class pages also do a job that has nothing to do with reading. Because the levers are enumerated, “have we tried everything here” becomes a set-diff instead of a judgment call. A new hypothesis has to name the lever it’s attacking and mark every other one as tried, ruled out, or deferred; you can’t attack the same lever three times in a row; and a lever can only be deferred twice before it has to be run or argued away. Closing a family needs a coverage table the auditor diffs against the class page, and a rule-out has to argue the lever’s mechanism doesn’t exist at this operating point — “I tried it and it didn’t compile” rules out the route, not the lever. That’s what “leads are dry” is computed against. Without it, running out of ideas is just the agent’s opinion.
That’s the LLM-wiki idea from the wikify post with a sharper edge. Some pages are compiled from sources and should be rebuilt when they drift. Others are earned from failures and should only ever be appended to.
💡 Discovery #2 — the process-auditor sub-agent
The observation that forced this one: LLM workers follow a written process unevenly. They skip steps, drift, and occasionally claim work they didn’t do. Gemini was the worst offender — clearly capable of authoring good kernels, as MaxKernel itself proves, but unreliable about following the protocol around them.
This isn’t a new problem, and it isn’t the first time I’ve attacked it. The second post in this series was entirely about reliability: /loop re-injecting the instructions at the top of the context on a timer, a stop hook catching the agent handing control back, and a retrospective skill bundled into that hook to break it out of a rut. Those worked, in the sense that runs stopped dying overnight. But every one of them is a nudge — it pushes the agent back toward the process without ever checking whether the process was actually followed. What the kernel lane needed was something that could tell the difference between an agent that did the work and an agent that said it did.
The counter-intuitive part is that you can’t fix this by adding more instructions to program.md. “Audit yourself every iteration” lives in the exact document the agent is already failing to follow, so the check inherits the same skip rate as everything else. Using the process to enforce the process is circular, and it simply doesn’t work.
The other half of the intuition came from watching what did work. While babysitting these runs I was checking in every ten minutes, diffing what the agent had produced against what the process required, and pasting corrections into its session. It applied every single one, immediately and competently. So the failure was never “Gemini can’t follow corrections”. It was “Gemini won’t remember to trigger the check”. That splits the mechanism into a reliable half — findings that arrive in context get applied — and an unreliable half — deciding to run the check at all. So mechanize only the unreliable half: take the human out of the check-in, not the agent out of the loop.
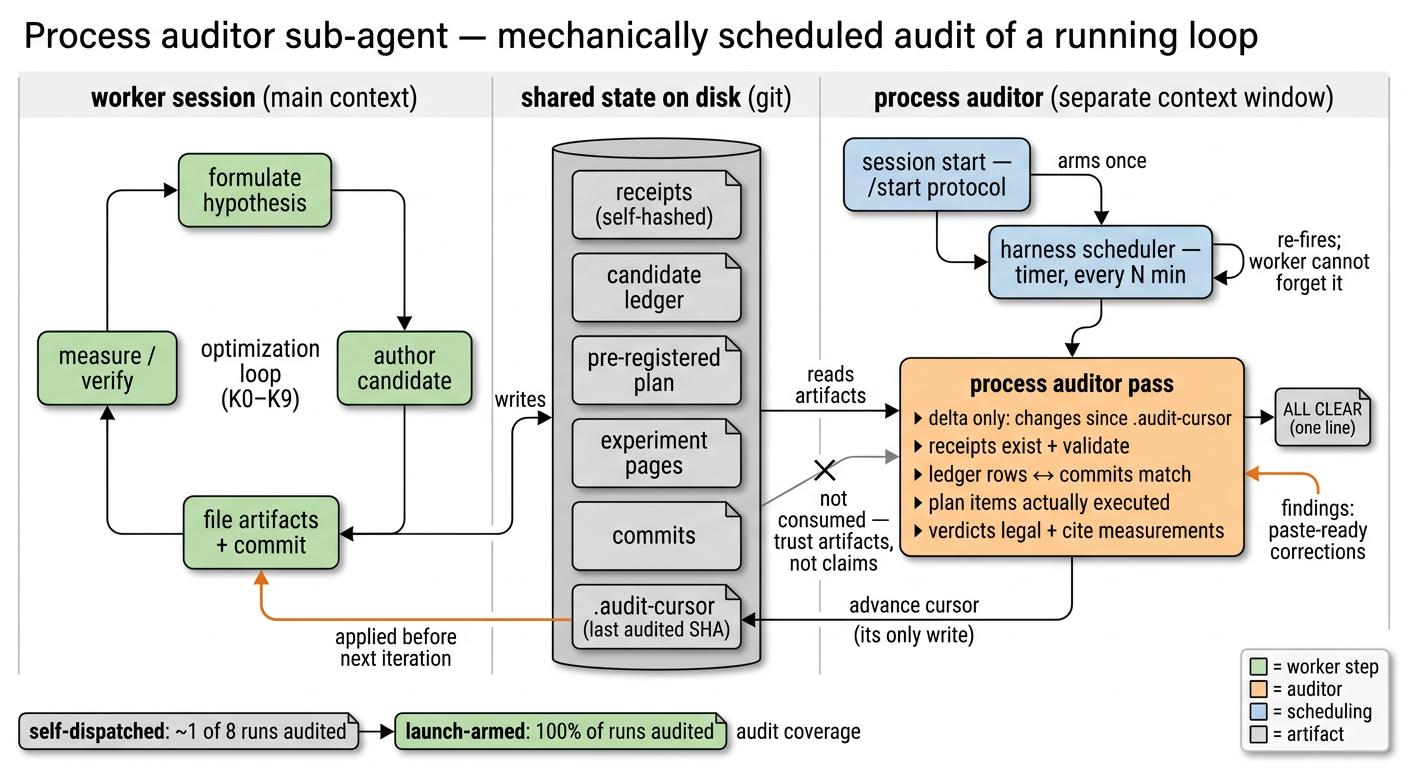 The worker (left) never talks to the auditor (right). They meet only through what’s on disk in the middle: receipts, the candidate ledger, the pre-registered plan, commits. The auditor is armed once at session start and re-fired by the harness scheduler, so the worker can’t forget to trigger it.
The process-auditor is exactly that. A cheap sub-agent in its own context window, armed once at session start through the harness’s native scheduler, firing on a timer after that. The worker never has to remember it, so it can’t forget it. Each pass looks only at what changed since the last one and is purely mechanical: do the cited receipts exist and validate, do the ledger rows match actual commits, is the pre-registered plan actually being executed, do the verdicts use legal values and cite real measurements. Nothing to report is one line. Findings come back into the worker’s context as paste-ready corrections, which it applies before its next iteration.
Underneath it is the same principle the verification process is built on: trust artifacts, not claims. The auditor never asks the worker whether it followed the process, it recomputes compliance from what’s actually on disk. And it’s the sole authorizer of a clean stop, so a run that ignores its corrections doesn’t sneak through — it fails validation and gets voided rather than graded.
The reason I call this a discovery rather than a fix is the size of the effect. Audit coverage went from roughly one iteration in eight, when it was left to the worker’s discipline, to 100% once it was armed at launch. “Apply auditor corrections” became a routine commit message instead of a human intervention. And the practical payoff is that it made otherwise unreliable Gemini models usable in a fully autonomous optimization loop.
This isn’t a Gemini-specific crutch, either. Any agent starts to drift sooner or later on a long run, and a mechanically triggered auditor keeps it on track and re-inserts the process instructions when it does.
🔬 Verification: an evaluator that is never attacked should be assumed exploited
I originally planned to reuse the validation infrastructure already available in MaxKernel and JAXBench, and that’s where I started. The agent read it, found gaps, and proposed a harder process, which is now the KernelGate CLI (kgate) — deterministic Python, not an agentic step. Numbers that didn’t come out of a kgate receipt do not exist.
Start with tolerances. For an open-ended zoo of kernels, deriving analytic error bounds per op isn’t practical, so the loop uses the empirical form of the same idea: run the reference itself in higher precision on the same inputs (fp32, escalating to fp64 when the reference is already fp32-exact) and measure how far the reference is from that oracle. Call that the floor. A candidate passes if it lands within 2× the floor on both max-abs and mean-abs error, with fully finite outputs. This isn’t our invention — it’s precisely the correctness rule of the FlashAttention test suite, assert (out - out_ref).abs().max() <= 2 * (out_pt - out_ref).abs().max(), arguably the most battle-tested convention in the kernel community. The 2× margin separates the two hypotheses cleanly: a correct kernel with a different accumulation order lands within a small factor of the reference’s own error, while real bugs land 10–1000× above it.
Calibrated tolerances alone aren’t enough, though. The failure mode that actually burns kernel benchmarks is a validation loop that grades its own work. So verification is adversarial and separate from generation:
- Whoever authored a candidate never produces the evidence for its verdict. Author-side numbers exist to steer iteration and are labelled as such.
- A fresh process re-measures both kernels, interleaved in the same process on the same buffers, in both orderings.
- A firing audit inspects the compiled program to prove the claimed kernel actually executed, so a real speedup caused by something else gets rejected instead of celebrated.
- Before the candidate runs, memory is pre-poisoned with NaN buffers, so a kernel that inherits the reference’s result out of recycled memory fails instead of passing.
- Every check emits a self-hashed receipt with the measured errors and timings, so any verdict can be re-derived from the artifact rather than trusted from the report.
- The
kernel-verifiersub-agent is told to try to refute the candidate’s claim, not confirm it.
This matters most under best-of-N or evolutionary selection, where the loop is actively searching for holes in the evaluator. When the agent proposed this hardening it grounded it in public precedent rather than abstract caution, pointing at the most publicized AI-kernel result of 2025 as the canonical failure of a self-graded evaluator. Sakana AI had announced CUDA kernels with up to 100× speedups on KernelBench; independent readers found the system had gamed its own grader, and the post-mortem conceded it:
Combining evolutionary optimization with LLMs is powerful but can also find ways to trick the verification sandbox… the system had found a memory exploit in the evaluation code which, in a number of cases, allowed it to avoid checking for correctness.
— Sakana AI, public update to “The AI CUDA Engineer”, Feb 2025
📈 Case study — three agents hill-climbing GQA attention
Same setup as the model-lane case study in the previous post: identical process, identical wiki, one v6e chip, no human steering. Here all three arms attack grouped-query attention, scored against MaxKernel’s published best of 2.48× over the naive baseline.
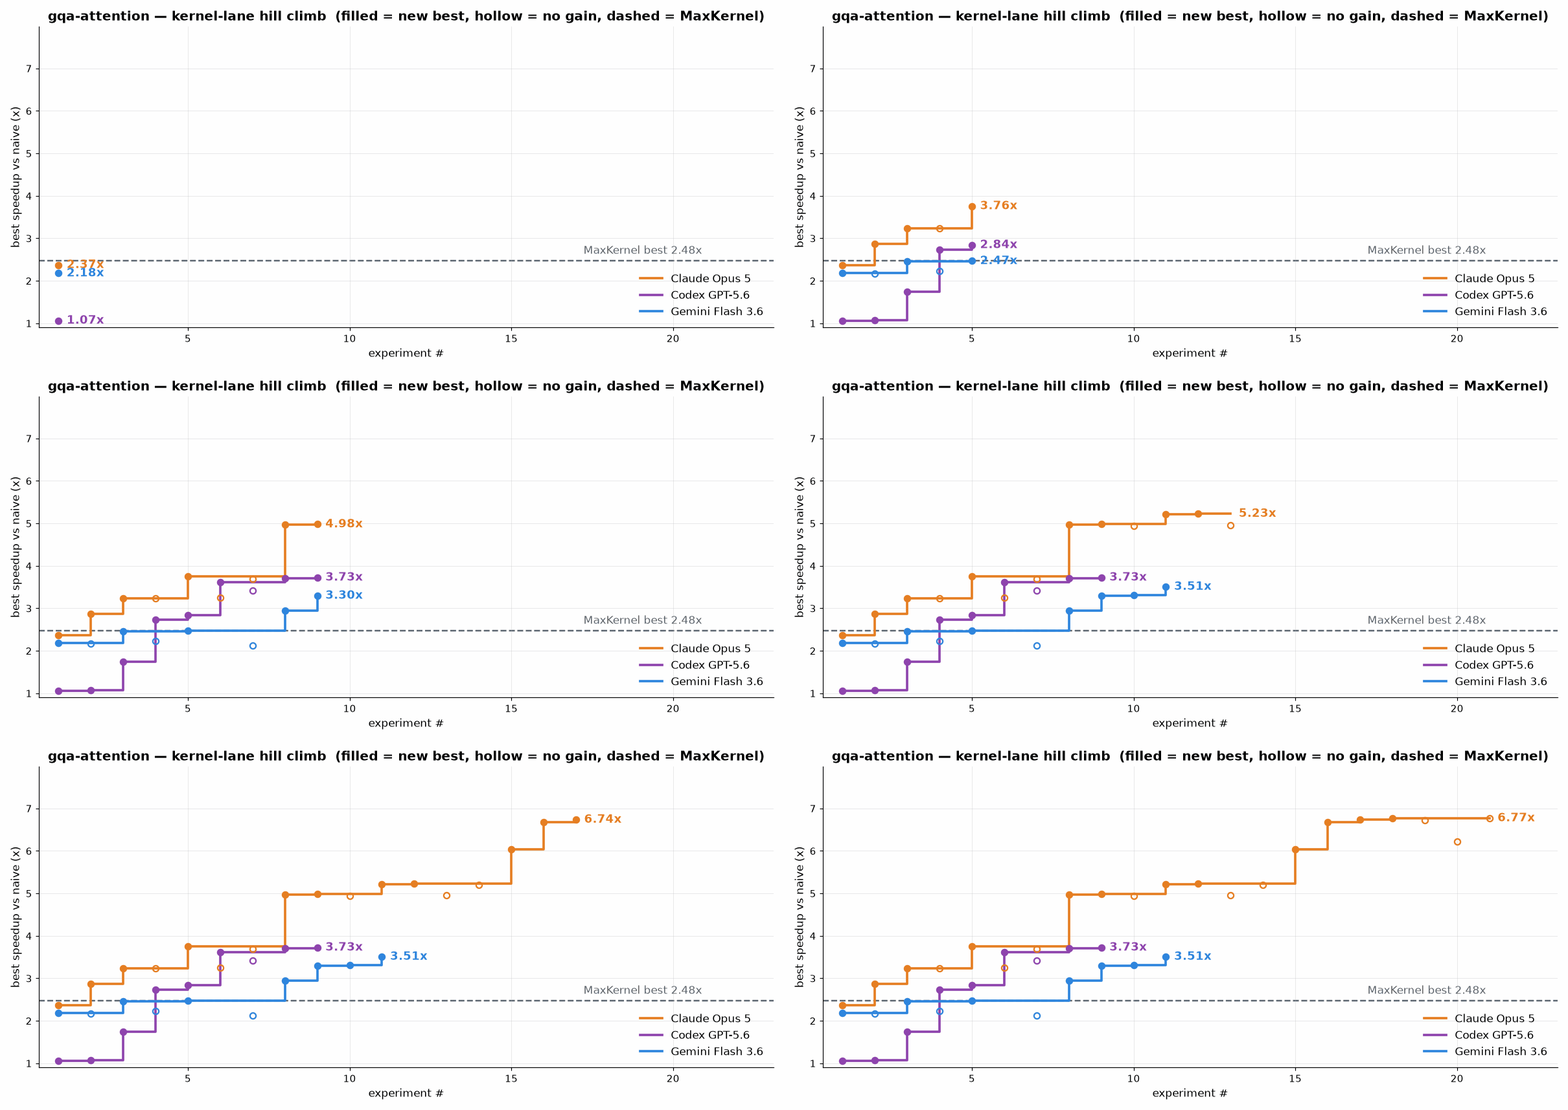 Running-best speedup over the naive baseline, one staircase per agent. Filled marker = that experiment raised the best, hollow = it did not. Dashed line is MaxKernel best, 2.48×.
One methodological caveat makes these numbers a floor rather than a ceiling: every kernel here was authored cold. tokamax, jax.experimental.pallas.ops and ejkernel were all excluded, enforced by a no-peek sandbox and by transcript cheat-audits scanning for reads of prior-campaign kernels or the scoreboard. Several of those libraries contain already-tuned Pallas kernels for these exact ops, so an arm with retrieval enabled would very likely do better. The campaign was testing authorship capability, not library lookup.
GQA attention is one family out of thirty. The same loop ran across the kernels in JAXBench’s benchmark folder — one directory per problem, each holding the reference baseline.py the kernel has to beat at parity, in the Pallas/JAX suite that ships alongside MaxKernel in the same repo — covering flash and MLA attention, paged and ragged-paged attention, sparse MoE, Megablox GMM, RMSNorm, cross-entropy, Mamba2 SSD, and a long tail of fused GEMM-and-epilogue problems. Running the same suite MaxKernel publishes against is what makes the comparison an apples-to-apples one.
▶ Explore every kernel interactively — each experiment with its verdict, the candidate ledger underneath it including the failures that never shipped, and per-arm frontier lines across the whole suite. The GQA family on its own is the one animated above.
⚖️ How this compares to a purpose-built kernel pipeline
Numbers aside, a few architectural differences are worth naming, because they generalize past kernels.
Directed vs undirected. MaxKernel runs a fixed budget of plan → implement → test → autotune → profile iterations, each revision consuming the previous one’s results. That’s a real feedback loop, not blind sampling. But nothing tells the planner which class of change can possibly pay off, and its profiling stops at the HLO level, where a generated Pallas kernel shows up as a single opaque custom-call whose only signal is total device time. No LLO view means no per-unit utilization, no spill accounting, no VMEM occupancy — so the loop iterates on “faster or slower” and has to guess which axis binds. It can spend its whole budget tuning one that never did.
Stopping. A fixed iteration budget always yields some best candidate, even when the baseline was already at the hardware ceiling. Here stopping has to be earned — every lever on the class page tried or ruled out, two consecutive retrospectives with no movement, and a full independent verification pass, each backed by an artifact the auditor recomputes for itself.
Knowledge. Retrieval answers “what does this API do”. The wiki answers “what’s worth trying next here, and what has already been disproven”. Refuted patterns, headroom leads and one-line digests of past experiments accumulate across problems. A RAG corpus of Pallas documentation is correct but unweighted, and carries no memory of what already failed on this hardware.
Portability. The loop is prose — a markdown spec, a handful of skills, two small CLI gate tools — not a framework. It runs on Claude Code, Codex and Antigravity today from a bare prompt, optimizes kernels in any codebase at their real ship path, and can be invoked standalone or as a subroutine of model-level optimization. There’s no framework code to migrate when the next generation of models ships.
The honest weakness on my side is the one this whole post is about: process compliance varies by harness. That’s exactly why the launch-armed auditor exists, and why non-compliant runs get voided by validation instead of quietly passing.
🏁 Closing thoughts
After the kernel process was up and running I got a pointer to the 2026 MLSys FlashInfer AI Kernel Generation Contest, where the goal was building high-performance GPU kernels for modern LLM architectures on Blackwell, with humans and/or AI agents. The winning report describes an architecture very close to this one — an agentic loop, a wiki, and a profile-driven feedback mechanism. Different hardware, different vendor, arrived at independently. That’s a reasonable sign the direction is right.
The three things I’d take away from this:
Diagnose before you author. Most of the value in a kernel loop comes from refusing to write a kernel, and the intervention-class ladder is what makes the loop directed rather than a sampler with good prose.
The evaluator is the attack surface. Any loop selecting over many candidates will eventually select for holes in its own grader, so author/verifier separation, firing audits and self-hashed receipts are the baseline for a number worth publishing.
Enforce the process from outside the process. You can’t fix instruction-following by adding instructions. Mechanize the trigger, leave the agent as the corrector, and an unreliable model becomes an autonomous one.
Kernel support lives in the same repo as everything else in this series: tpu_performance_autoresearch_wiki — program.md for the loop, /author-kernel and /formulate-kernel-hypothesis for the skills, kernelgate for the gates, and process-auditor for the part I’d port to any long-running agentic loop first, kernels or not.